Step 4: Develop a Learning Picture
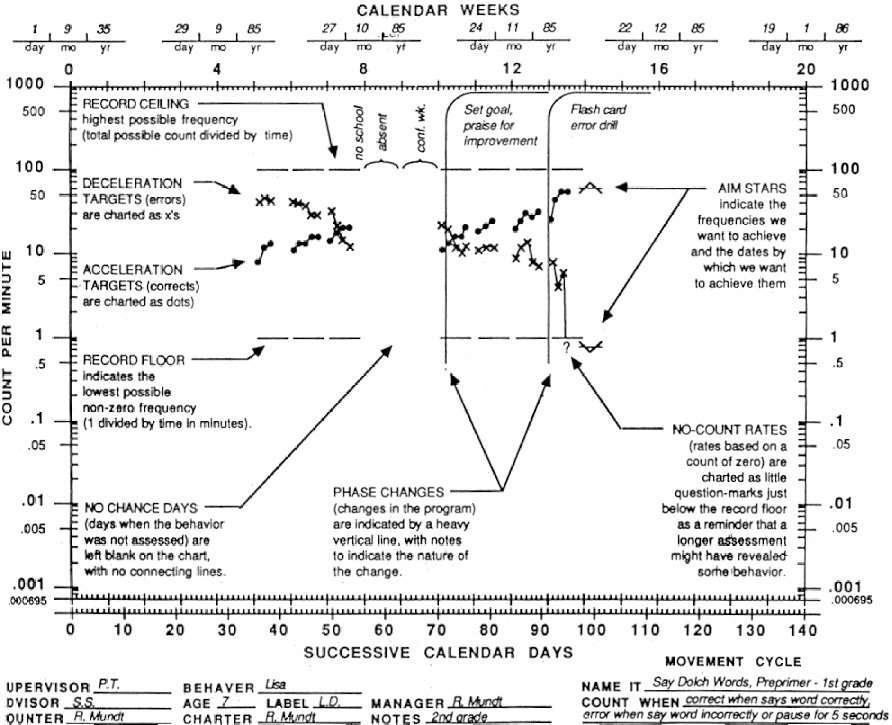
We have already discussed the Standard Celeration Chart and you have seen an illustration of the chart along with charting conventions in Figure 1. The chart is inspected for changes in counts per minute over daily assessment periods for both correct and incorrect movements. The two trends form a learning picture. The picture tells the teacher and student how rapidly the movements are increasing or decreasing and helps them project if or when the student will reach aim and "0". Some examples of typical learning pictures are illustrated in McGreevey (1983) and White & Haring (1980).
Standard Celeration Chart