Factorial Designs: Main Effects
The main effect in a factorial design is "the effect of one independent variable averaged over all levels of another independent variable" (McBurney, 2004, p. 289). Table 4 below shows hypothetical data for our 2 x 2 factorial design example.
| TASK DESCRIPTION (B) | ||||||||
| None (B1) | "Hard" (B2) | Row Mean | ||||||
| DRUG DOSAGE (A) | 0 mg (A1) |
|
3 | |||||
| 10 mg (A2) | 6 | |||||||
| Column Mean | 2 | 7 | ||||||
The number in each cell represents the mean number of errors on the memory task for subjects who experienced that condition. The row means are shown to the right of the table, and the column means are shown at the bottom of the table. There are two main effects to consider, one for Factor A and one for Factor B. Regarding the main effect for Factor A, we ask: Did drug dosage affect performance on the memory task? To answer this question we compare the mean of A1 over the two levels of Factor B (top row mean) with the mean of A2 over the two levels of Factor B (bottom row mean). We see that subjects on average made fewer errors when the pill did not contain the drug (mean = 3 errors) than when the pill did contain the drug (mean = 6 errors). We conclude that there is a main effect for Factor A, that is, the drug enhanced errors on the memory task. Regarding the main effect for Factor B, we ask: Did leading subjects to believe that the task was difficult affect memory task performance? To answer this question we compare the mean of B1 over the two levels of Factor A (left column mean) with the mean of B2 over the two levels of Factor B (right column mean). We see that subjects on average made fewer errors when they were told nothing about the task difficulty (mean = 2 errors) than when they were told that the task was "hard" (mean = 7 errors). We conclude that there is a main effect for Factor B, that is, being told that the task was "hard" enhanced errors on the memory task.
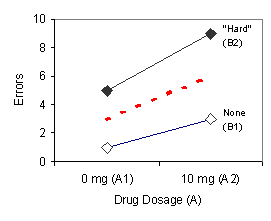
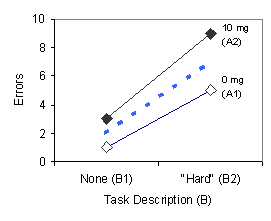
Figure 2 below shows how these main effects for Factor A and Factor B would look on a graph.


FIGURE 2. Graphs illustrating a main effect for Factor A (left panel) and Factor B (right panel).
The two solid lines on the graph in the left panel show the effect of the drug (Factor A) for both levels of task description (Factor B). This graph illustrates mean number of errors as a function of drug dosage with task description as a parameter. Errors increase across the two levels of the drug (A1 and A2) both when subjects were told nothing about the task difficulty (line B1) and when they are told that the task was "hard" (line B2). The dashed red line shows the average increase (the two row means in Table 3) across the two levels of the drug; this is the main effect for Factor A. The two solid lines on the graph in the right panel show the effect of the task description (Factor B) for both levels of the drug (Factor A). This graph illustrates mean number of errors as a function of task description with drug dosage as a parameter. Errors increase across the two levels of task description (B1 and B2) when the pill does not contain the drug (line A1) and when the pill does contain the drug (line A2). The dashed blue line shows the average increase (the two column means in Table 2) across the two levels of task description; this is the main effect for Factor B.
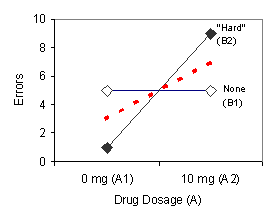
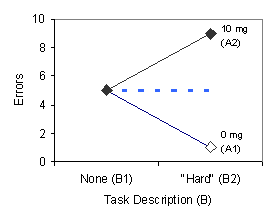
What if there was no main effect for one or both of the factors? What might these data look like? Let's consider the case in which there is a main effect for Factor A and no main effect for Factor B. Such results are shown in Table 5 and the data are plotted in Figure 3, both presented below.
| TASK DESCRIPTION (B) | ||||||||
| None (B1) | "Hard" (B2) | Row Mean | ||||||
| DRUG DOSAGE (A) | 0 mg (A1) |
|
3 | |||||
| 10 mg (A2) | 7 | |||||||
| Column Mean | 5 | 5 | ||||||


FIGURE 3. Graphs illustrating a main effect for Factor A (left panel) and no main effect for Factor B (right panel).
The row means in Table 5 show that subjects on average made fewer errors when the pill did not contain the drug (mean = 3 errors) than when the pill did contain the drug (mean = 7 errors). Again, we conclude that there is a main effect for Factor A, that is, the drug enhanced errors on the memory task. The main effect for Factor A is illustrated by the non-flat, dashed red line in the left panel of Figure 3. Table 5 also reveals that subjects on average made the same number of errors (mean = 5 errors) when they were told nothing about the task difficulty and when they were told that the task was "hard." We conclude that there is no main effect for Factor B, that is, being told that the task is "hard" does not increase errors on the memory task. The flat, dashed blue line in the right panel of Figure 3 illustrates the absence of a main effect for Factor B.